Obviously, this feature is only available for charts that actually have axes in the first place, meaning that charts such as pie charts and doughnut charts can’t really have axis labels. In addition, some charts that have axes (such as radar charts) don’t really have the capability to display axis titles so this feature also doesn’t apply to them. Axis labels are also available for all of the axes a chart has, which means that you can even have a label for the depth axis in 3D charts and and labels for the secondary horizontal and secondary vertical axes for charts that have them. Excel also allows users to link the label they create for an axis to be linked to corresponding text in a worksheet’s cells by simply creating a reference to those specific cells. Adding labels to the axes of a chart is a pretty simple and straightforward process regardless of what version of Microsoft Excel you are using. However, it should be noted that adding labels to the axes of charts works a bit differently in Microsoft Excel 2013 and 2016 than it did in Microsoft Excel 2007 and 2010.
To add axis labels in Microsoft Excel 2007 and 2010
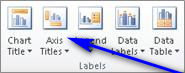
To add labels to the axes of a chart in Microsoft Excel 2007 or 2010, you need to:
To add axis labels in Microsoft Word 2013 and 2016
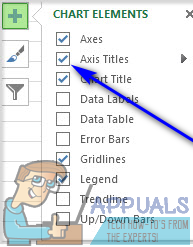
If you would like to add labels to the axes of a chart in Microsoft Excel 2013 or 2016, you need to:
How To Make Labels and Sub-Labels in GmailHow to Change X Axis Values in ExcelCreating and Printing Various Labels in Microsoft Word ProfessionallyHow to Add Error Bars in Microsoft Excel?