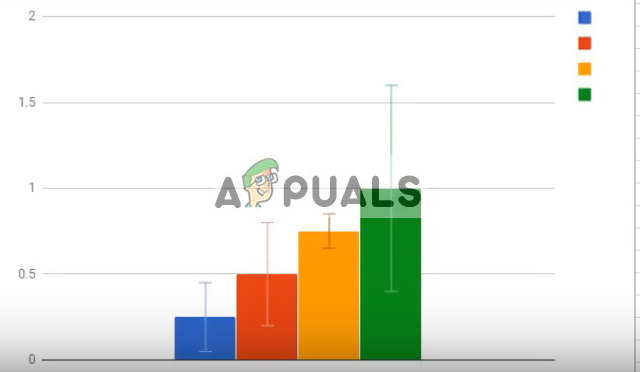
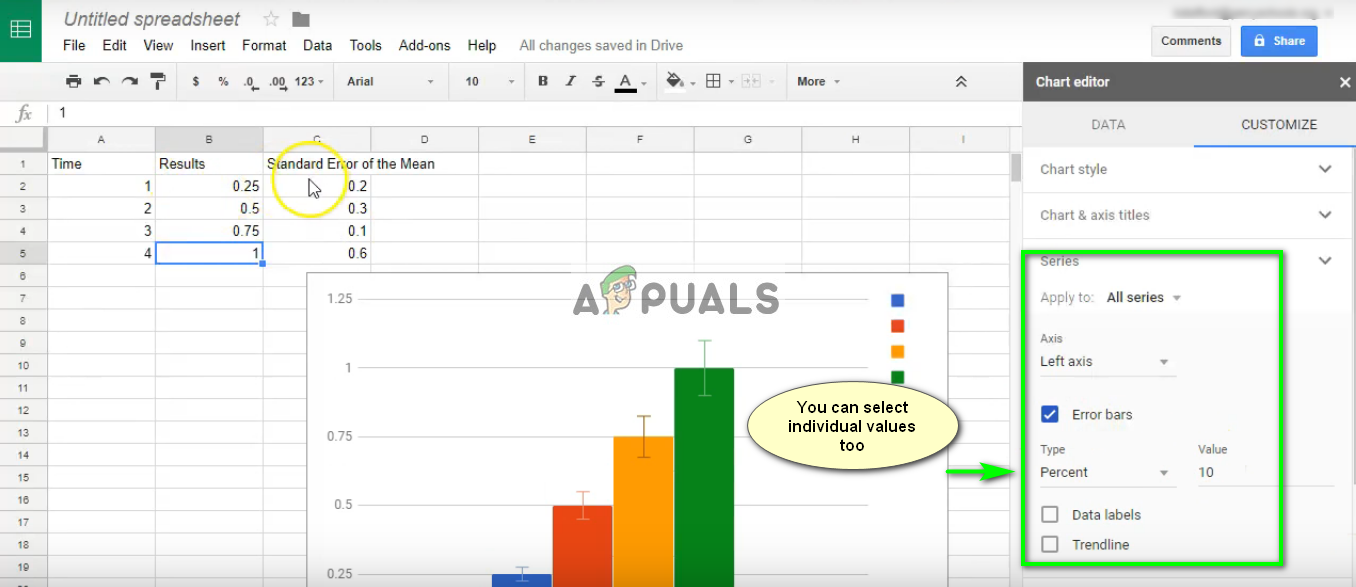
Like Excel of Office, Sheets also have the feature of displaying error bars in a document. Error bars are graphical representations of the variability of data and are used to indicate the error or uncertainties of reported measurements. This gives the user an idea of how precise the measurement is.
How to add error bars in Google Sheets?
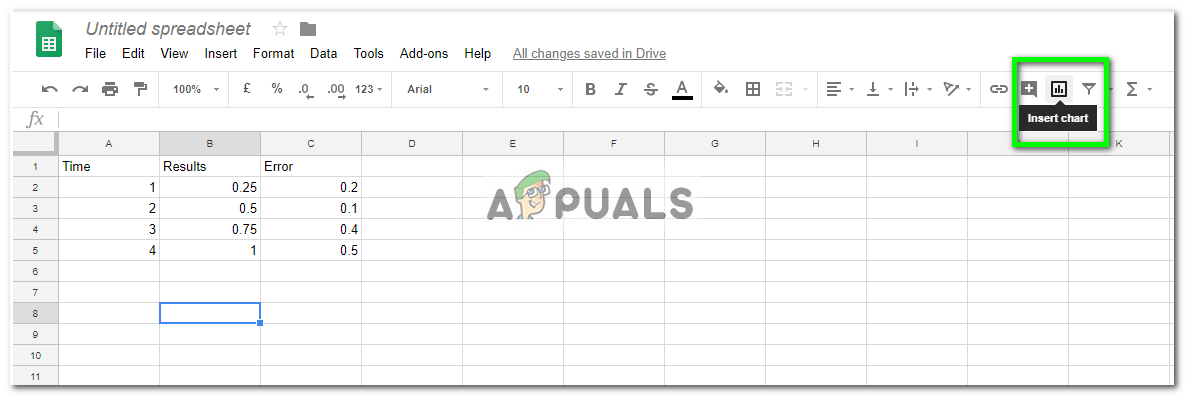
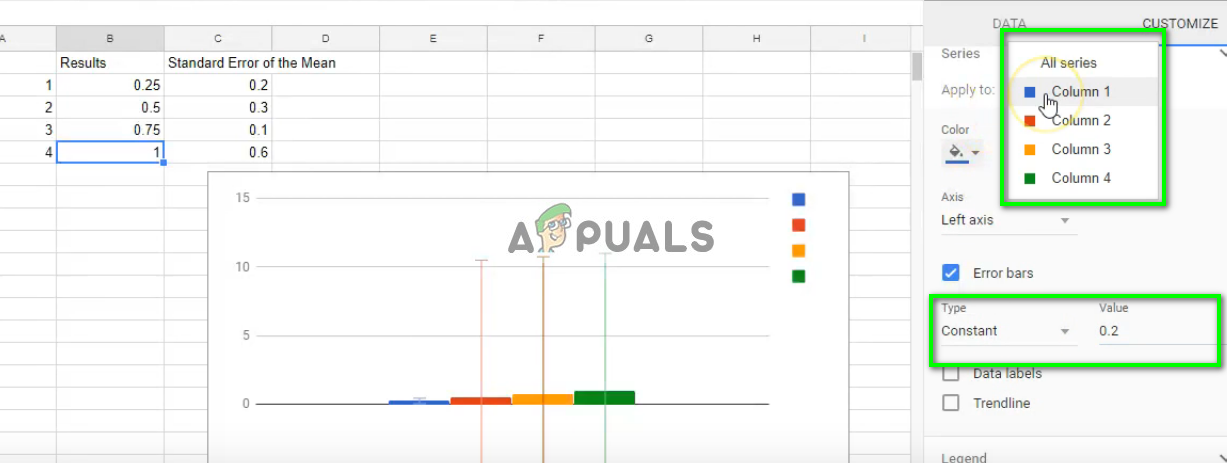
In order to add error bars against your data in Sheets, you should first make sure that you have complete measurements and the error against each one. This step is necessary as error bars can only be represented if there are proper X and Y axis. If you do not have Error values, you can also use a standard percentage against your graph. It all depends on your work/project. A good way to determine if you have inserted the values correctly is to see if there are different colors in the chart. If they aren’t, you can try inserting the data again correctly.
How to Add Error Bars in Microsoft Excel?Fix: “Formula Parse Error” with Examples on Google Sheets?How to Remove Duplicates from Google SheetsHow to Create a Drop Down List on Google Sheets